Maryland Population Density
Maryland Population Density Map
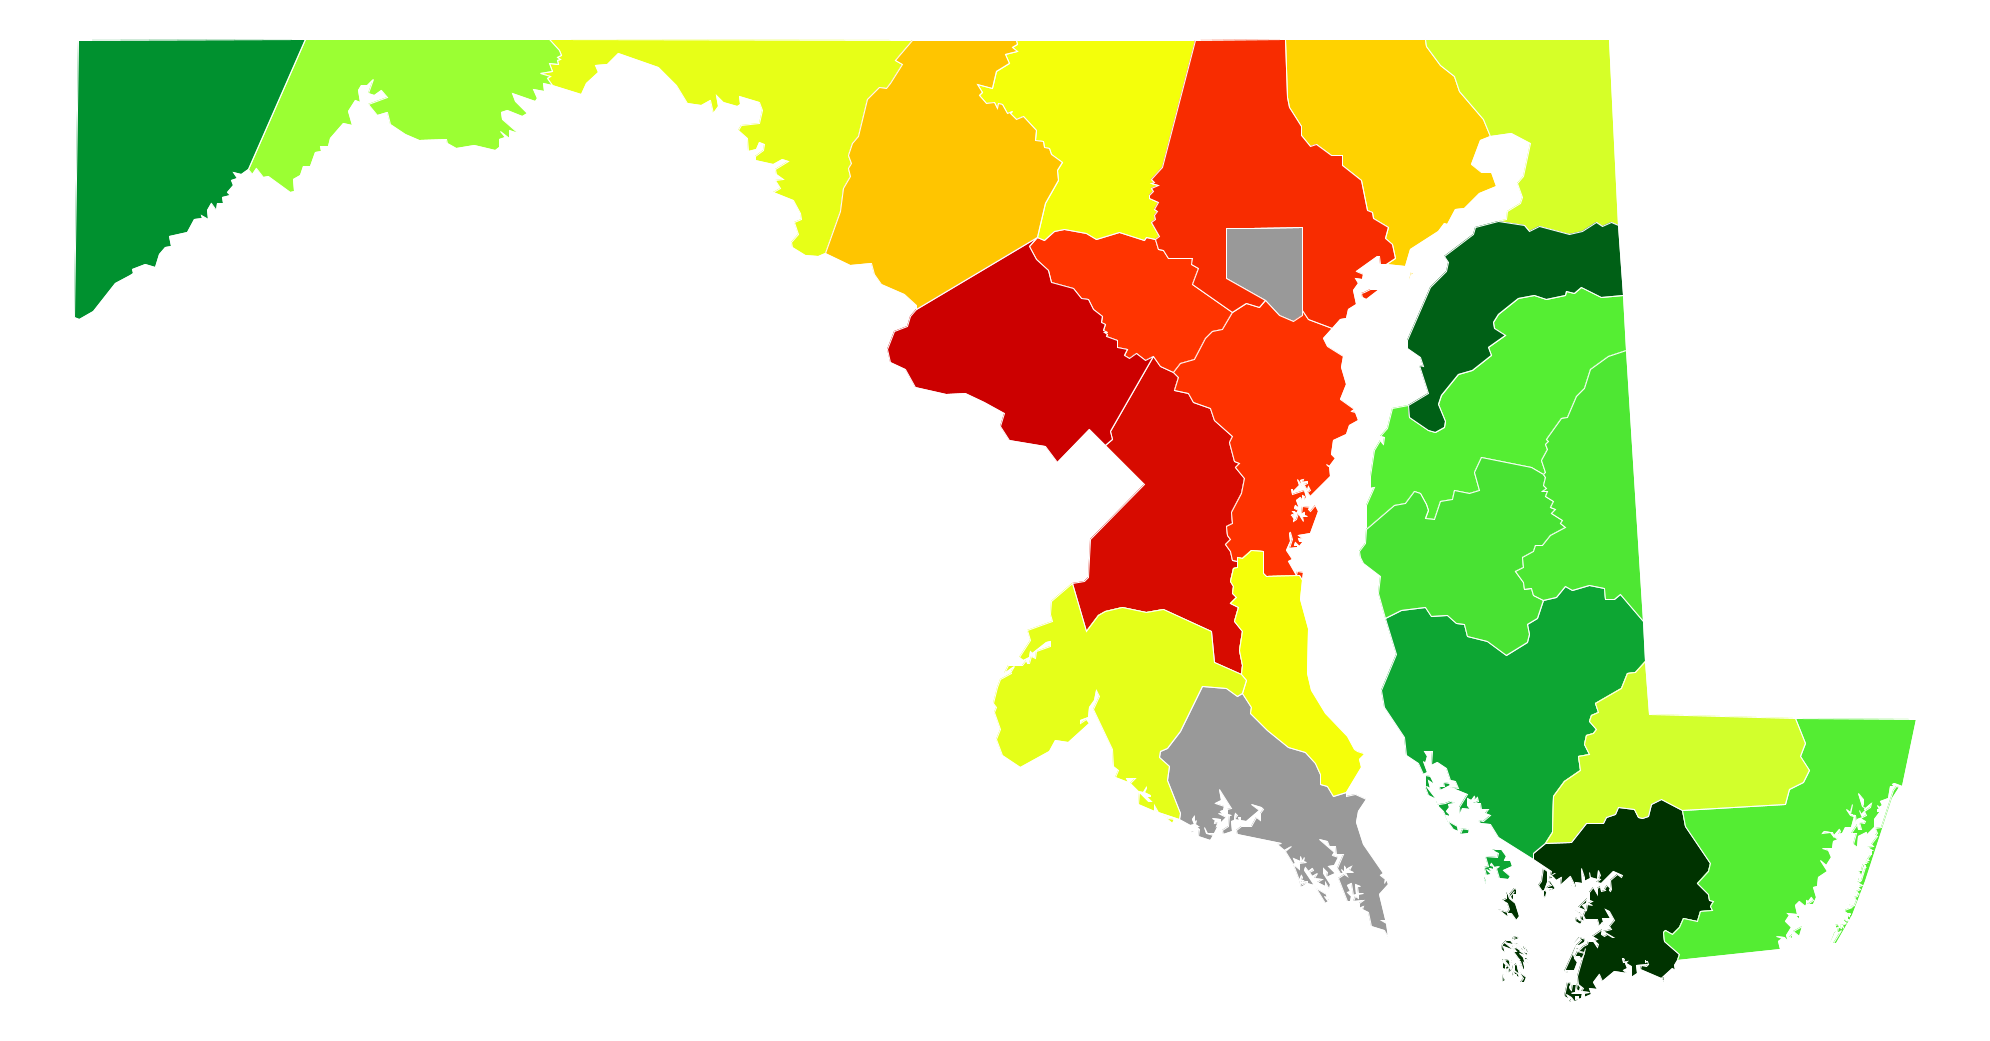
Maryland Population Density by County
| County | Population Density (Population/km2) | Population | Area (km2) |
|---|---|---|---|
| Montgomery County | 774 | 1,016,677 | 1,313 |
| Prince George's County | 690 | 890,081 | 1,291 |
| Baltimore County | 497 | 823,015 | 1,655 |
| Anne Arundel County | 467 | 555,743 | 1,189 |
| Howard County | 464 | 304,580 | 656 |
| Harford County | 205 | 249,215 | 1,216 |
| Calvert County | 145 | 90,484 | 624 |
| Carroll County | 143 | 167,564 | 1,172 |
| Frederick County | 140 | 241,409 | 1,729 |
| Washington County | 124 | 149,588 | 1,210 |
| Charles County | 121 | 152,864 | 1,260 |
| Cecil County | 102 | 101,913 | 1,004 |
| Wicomico County | 98 | 100,896 | 1,034 |
| Allegany County | 66 | 73,521 | 1,108 |
| Queen Anne's County | 41 | 48,517 | 1,189 |
| Worcester County | 40 | 51,620 | 1,278 |
| Caroline County | 39 | 32,693 | 844 |
| Talbot County | 37 | 37,931 | 1,018 |
| Somerset County | 30 | 26,273 | 890 |
| Kent County | 24 | 19,944 | 831 |
| Dorchester County | 18 | 32,660 | 1,809 |
| Garrett County | 18 | 29,889 | 1,703 |
Comments
© 2018 AtlasBig.com