Kentucky Population Density
Kentucky Population Density Map
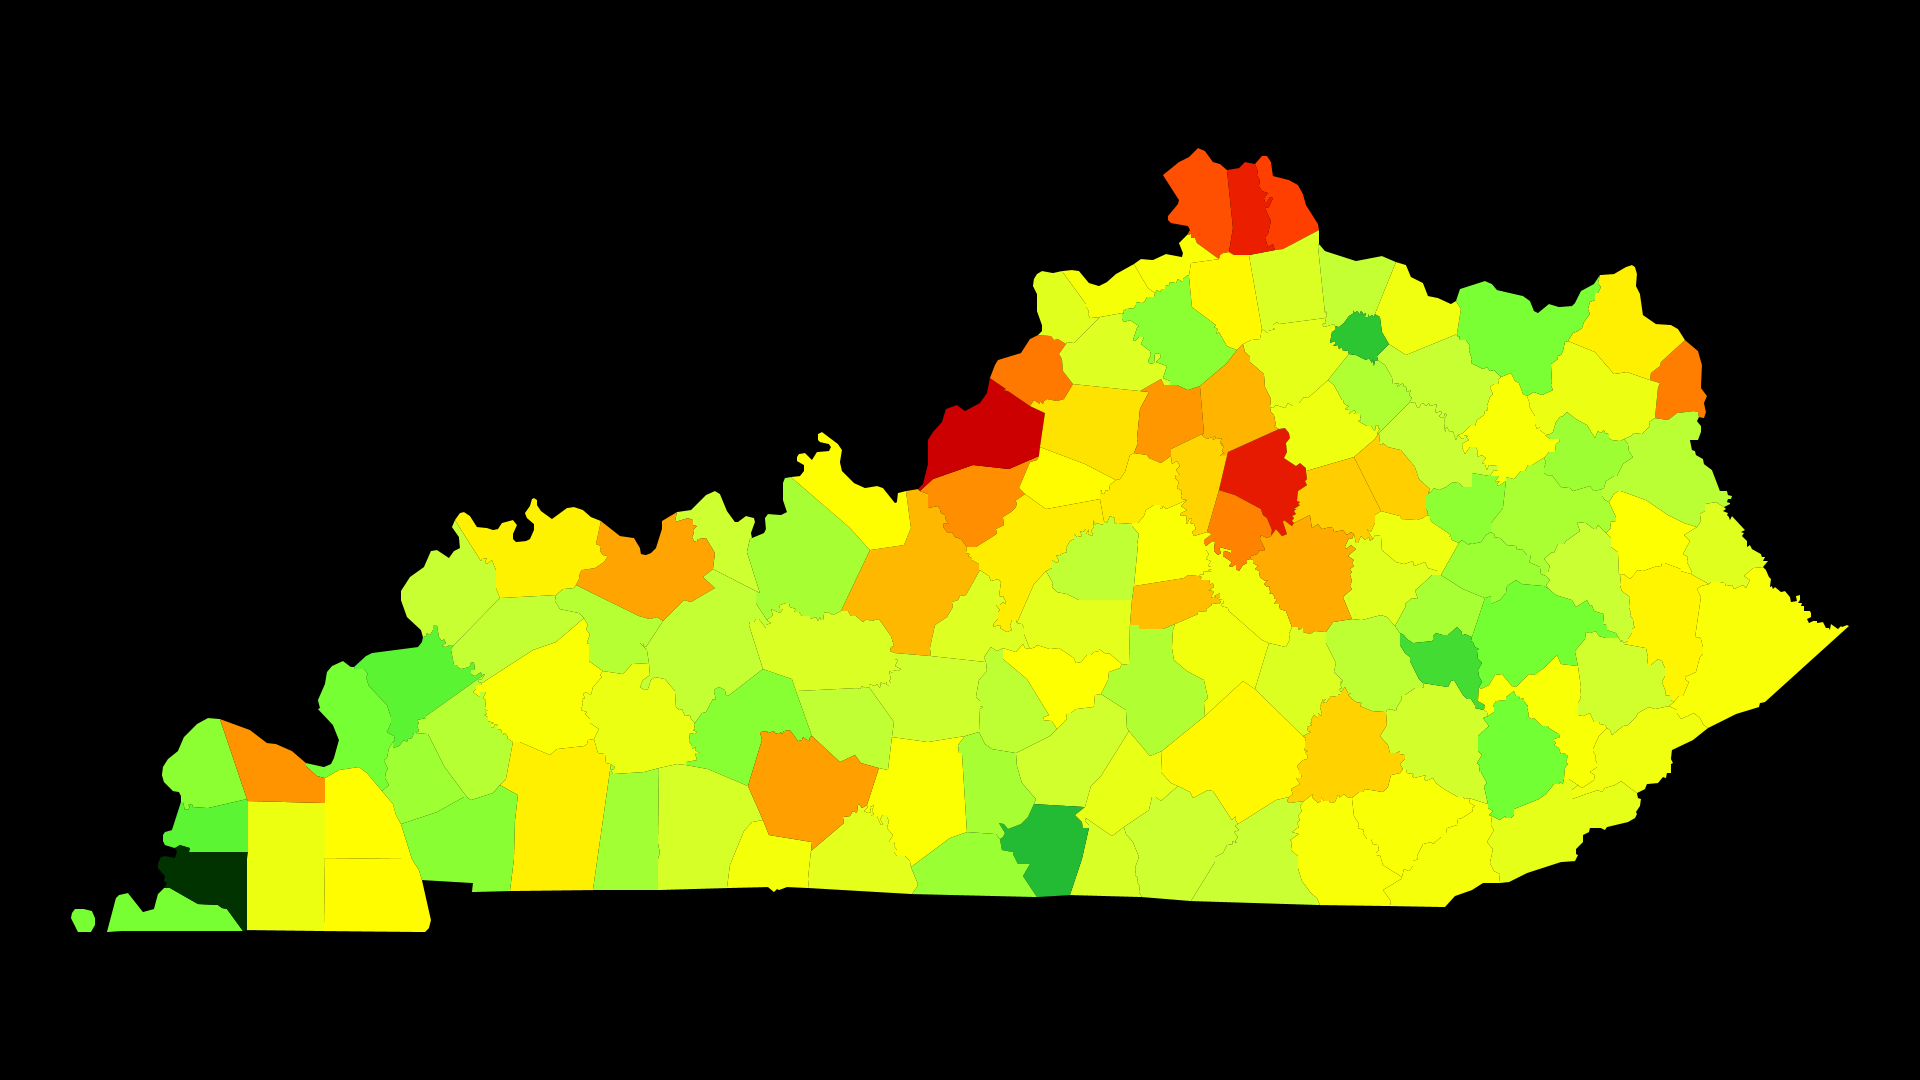
Kentucky Population Density by County
| County | Population Density (Population/km2) | Population | Area (km2) |
|---|---|---|---|
| Jefferson County | 735 | 756,832 | 1,030 |
| Fayette County | 417 | 308,428 | 740 |
| Kenton County | 383 | 163,145 | 426 |
| Campbell County | 221 | 90,988 | 412 |
| Boone County | 187 | 124,442 | 665 |
| Oldham County | 123 | 62,364 | 509 |
| Boyd County | 116 | 48,886 | 420 |
| Jessamine County | 111 | 50,173 | 452 |
| Bullitt County | 99 | 76,854 | 778 |
| McCracken County | 94 | 65,373 | 694 |
| Franklin County | 90 | 49,648 | 550 |
| Warren County | 83 | 118,370 | 1,419 |
| Daviess County | 80 | 98,218 | 1,233 |
| Madison County | 74 | 85,590 | 1,149 |
| Scott County | 68 | 49,947 | 737 |
| Hardin County | 66 | 108,191 | 1,634 |
| Boyle County | 61 | 29,013 | 472 |
| Clark County | 54 | 35,614 | 657 |
| Montgomery County | 53 | 27,251 | 515 |
| Laurel County | 52 | 59,563 | 1,153 |
| Woodford County | 51 | 25,275 | 497 |
| Shelby County | 44 | 44,216 | 998 |
| Anderson County | 41 | 21,811 | 531 |
| Nelson County | 40 | 44,540 | 1,100 |
| Greenup County | 40 | 36,519 | 917 |
| Christian County | 39 | 74,167 | 1,879 |
| Henderson County | 39 | 46,347 | 1,199 |
| Floyd County | 38 | 38,728 | 1,027 |
| Pulaski County | 37 | 63,907 | 1,746 |
| Grant County | 37 | 24,753 | 677 |
| Spencer County | 36 | 17,637 | 497 |
| Calloway County | 35 | 37,657 | 1,063 |
| Marshall County | 35 | 31,107 | 886 |
| Meade County | 35 | 29,210 | 836 |
| Taylor County | 34 | 24,649 | 716 |
| Johnson County | 34 | 23,449 | 682 |
| Barren County | 33 | 43,027 | 1,295 |
| Hopkins County | 33 | 46,634 | 1,433 |
| Mercer County | 32 | 21,349 | 657 |
| Rowan County | 32 | 23,527 | 740 |
| Knox County | 32 | 31,790 | 1,005 |
| Perry County | 32 | 28,010 | 886 |
| Gallatin County | 31 | 8,474 | 271 |
| Pike County | 31 | 63,380 | 2,042 |
| Whitley County | 31 | 35,766 | 1,155 |
| Carroll County | 31 | 10,953 | 355 |
| Bell County | 30 | 27,885 | 938 |
| Simpson County | 29 | 17,793 | 611 |
| Lincoln County | 28 | 24,370 | 873 |
| Garrard County | 28 | 16,915 | 606 |
| Mason County | 27 | 17,278 | 638 |
| Letcher County | 27 | 23,619 | 878 |
| Powell County | 27 | 12,494 | 469 |
| Bourbon County | 26 | 19,998 | 757 |
| Graves County | 26 | 37,451 | 1,438 |
| Carter County | 25 | 27,202 | 1,068 |
| Muhlenberg County | 25 | 31,179 | 1,244 |
| Russell County | 24 | 17,752 | 734 |
| Harlan County | 23 | 28,499 | 1,214 |
| Harrison County | 23 | 18,518 | 803 |
| Marion County | 22 | 20,045 | 900 |
| Allen County | 22 | 20,311 | 913 |
| Estill County | 22 | 14,488 | 664 |
| Trimble County | 22 | 8,816 | 405 |
| Martin County | 21 | 12,647 | 596 |
| Larue County | 21 | 14,064 | 681 |
| Henry County | 20 | 15,445 | 754 |
| Rockcastle County | 20 | 16,693 | 821 |
| Pendleton County | 20 | 14,570 | 726 |
| Grayson County | 20 | 25,997 | 1,323 |
| Clinton County | 19 | 10,146 | 531 |
| Logan County | 19 | 26,876 | 1,443 |
| Clay County | 18 | 21,364 | 1,216 |
| Adair County | 18 | 18,732 | 1,069 |
| Knott County | 17 | 15,976 | 916 |
| Hart County | 17 | 18,573 | 1,083 |
| Hancock County | 17 | 8,687 | 515 |
| Wayne County | 17 | 20,678 | 1,250 |
| Bath County | 16 | 11,961 | 737 |
| Magoffin County | 16 | 12,950 | 803 |
| McCreary County | 16 | 17,989 | 1,126 |
| Union County | 16 | 15,029 | 941 |
| Fleming County | 16 | 14,508 | 911 |
| Bracken County | 16 | 8,416 | 542 |
| Ohio County | 16 | 23,988 | 1,547 |
| Webster County | 15 | 13,452 | 871 |
| Washington County | 15 | 11,875 | 780 |
| Edmonson County | 15 | 12,062 | 797 |
| Green County | 15 | 11,180 | 749 |
| Jackson County | 15 | 13,427 | 900 |
| Lawrence County | 15 | 15,856 | 1,088 |
| McLean County | 14 | 9,496 | 663 |
| Caldwell County | 14 | 12,823 | 902 |
| Casey County | 14 | 16,067 | 1,153 |
| Nicholas County | 14 | 7,039 | 509 |
| Morgan County | 13 | 13,380 | 995 |
| Lee County | 13 | 7,260 | 544 |
| Metcalfe County | 13 | 9,983 | 752 |
| Breckinridge County | 13 | 20,040 | 1,515 |
| Todd County | 13 | 12,503 | 973 |
| Lyon County | 13 | 8,451 | 666 |
| Elliott County | 13 | 7,637 | 606 |
| Wolfe County | 13 | 7,248 | 579 |
| Monroe County | 12 | 10,681 | 861 |
| Menifee County | 12 | 6,288 | 534 |
| Ballard County | 12 | 8,332 | 715 |
| Owen County | 12 | 10,662 | 917 |
| Trigg County | 11 | 14,293 | 1,246 |
| Butler County | 11 | 12,793 | 1,119 |
| Lewis County | 11 | 13,806 | 1,281 |
| Fulton County | 11 | 6,385 | 598 |
| Livingston County | 11 | 9,359 | 879 |
| Breathitt County | 11 | 13,545 | 1,283 |
| Leslie County | 10 | 11,019 | 1,051 |
| Carlisle County | 9.7 | 5,001 | 513 |
| Crittenden County | 9.7 | 9,255 | 953 |
| Owsley County | 9.1 | 4,654 | 513 |
| Robertson County | 8.6 | 2,235 | 260 |
| Cumberland County | 8.4 | 6,789 | 806 |
| Hickman County | 7.2 | 4,745 | 656 |
Comments
© 2018 AtlasBig.com