South Carolina Population Density
South Carolina Population Density Map
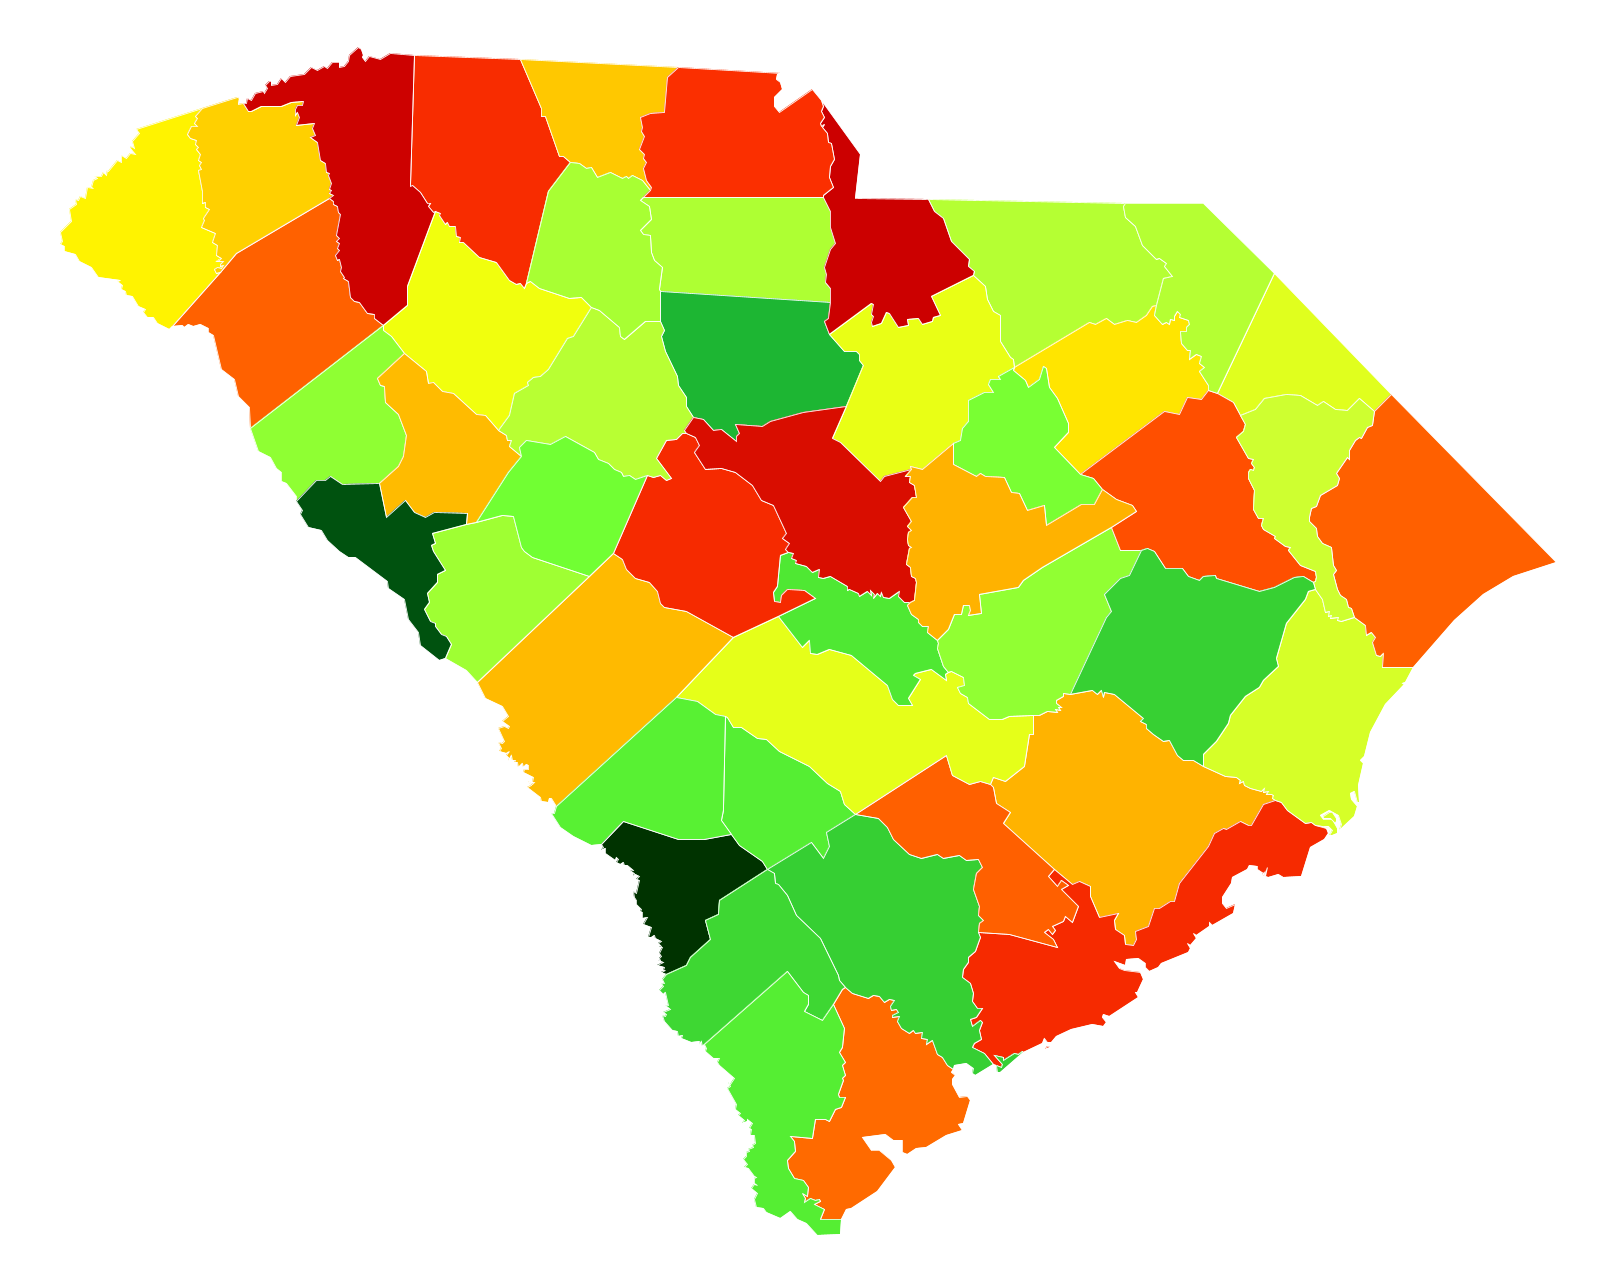
South Carolina Population Density by County
| County | Population Density (Population/km2) | Population | Area (km2) |
|---|---|---|---|
| Greenville County | 230 | 474,266 | 2,059 |
| Richland County | 199 | 399,256 | 2,002 |
| Charleston County | 141 | 372,803 | 2,641 |
| Lexington County | 140 | 273,752 | 1,957 |
| Spartanburg County | 137 | 290,969 | 2,122 |
| York County | 133 | 239,363 | 1,798 |
| Dorchester County | 98 | 145,397 | 1,482 |
| Horry County | 98 | 289,650 | 2,970 |
| Anderson County | 97 | 190,641 | 1,961 |
| Beaufort County | 92 | 171,838 | 1,863 |
| Pickens County | 90 | 119,829 | 1,327 |
| Florence County | 66 | 138,326 | 2,088 |
| Sumter County | 61 | 108,123 | 1,764 |
| Berkeley County | 61 | 194,020 | 3,193 |
| Aiken County | 58 | 164,176 | 2,806 |
| Greenwood County | 58 | 69,723 | 1,200 |
| Lancaster County | 56 | 80,458 | 1,438 |
| Cherokee County | 54 | 55,885 | 1,029 |
| Darlington County | 46 | 67,935 | 1,470 |
| Oconee County | 43 | 75,045 | 1,745 |
| Laurens County | 35 | 66,229 | 1,879 |
| Kershaw County | 33 | 62,516 | 1,914 |
| Orangeburg County | 31 | 90,942 | 2,908 |
| Dillon County | 30 | 31,229 | 1,046 |
| Georgetown County | 27 | 60,440 | 2,244 |
| Marion County | 25 | 32,072 | 1,277 |
| Newberry County | 22 | 37,521 | 1,669 |
| Marlboro County | 22 | 28,003 | 1,260 |
| Chesterfield County | 22 | 46,197 | 2,083 |
| Chester County | 21 | 32,578 | 1,517 |
| Union County | 21 | 28,030 | 1,340 |
| Edgefield County | 20 | 26,436 | 1,311 |
| Clarendon County | 19 | 34,355 | 1,807 |
| Abbeville County | 19 | 25,007 | 1,324 |
| Lee County | 17 | 18,347 | 1,071 |
| Saluda County | 17 | 20,091 | 1,200 |
| Barnwell County | 15 | 22,119 | 1,446 |
| Jasper County | 15 | 26,629 | 1,761 |
| Bamberg County | 15 | 15,430 | 1,022 |
| Calhoun County | 15 | 15,055 | 1,017 |
| Hampton County | 14 | 20,408 | 1,461 |
| Williamsburg County | 14 | 33,067 | 2,427 |
| Colleton County | 14 | 37,788 | 2,776 |
| Fairfield County | 13 | 23,109 | 1,840 |
| McCormick County | 9.7 | 9,947 | 1,022 |
| Allendale County | 9.2 | 9,839 | 1,075 |
Comments
© 2018 AtlasBig.com